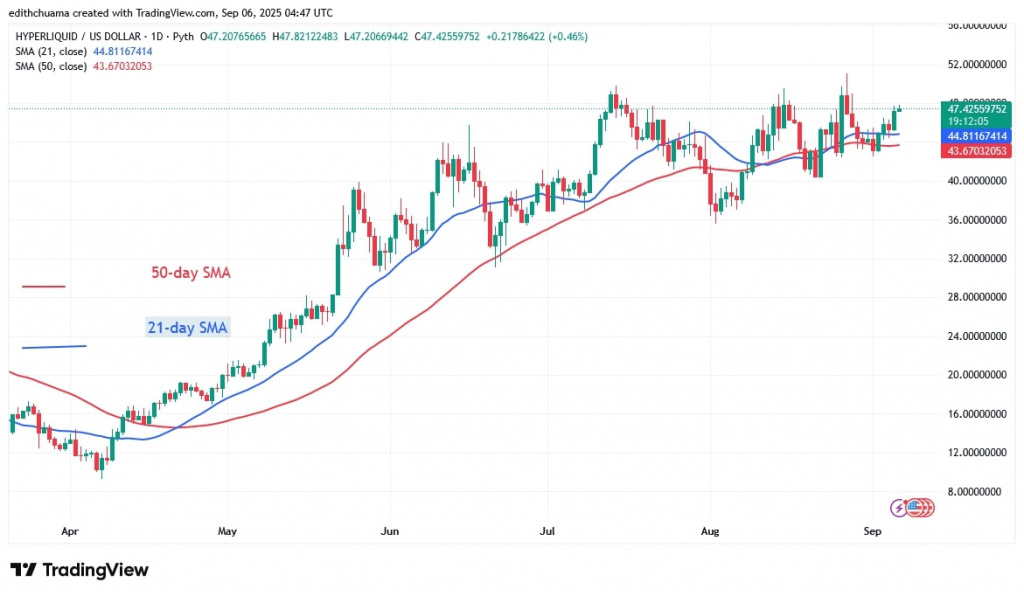
The price of Hyperliquid (HYPE) is moving sideways below the $50 threshold.
In August, as Coinidol.com wrote, the price of the cryptocurrency fluctuated below and above the moving average lines. In other words, the price range of the altcoin was between $40 and $50.
Hyperliquid price long-term analysis: ranging
On September 1, the bulls bought the dips and pushed the price above the moving averages. The upside correction remained stuck below the $48 mark as the altcoin continued to fluctuate above the moving average lines. On the upside, HYPE will rise if the bulls break through the $48 and $50 price levels. HYPE is trading at $46.93 at the time of writing.
HYPE price indicators analysis
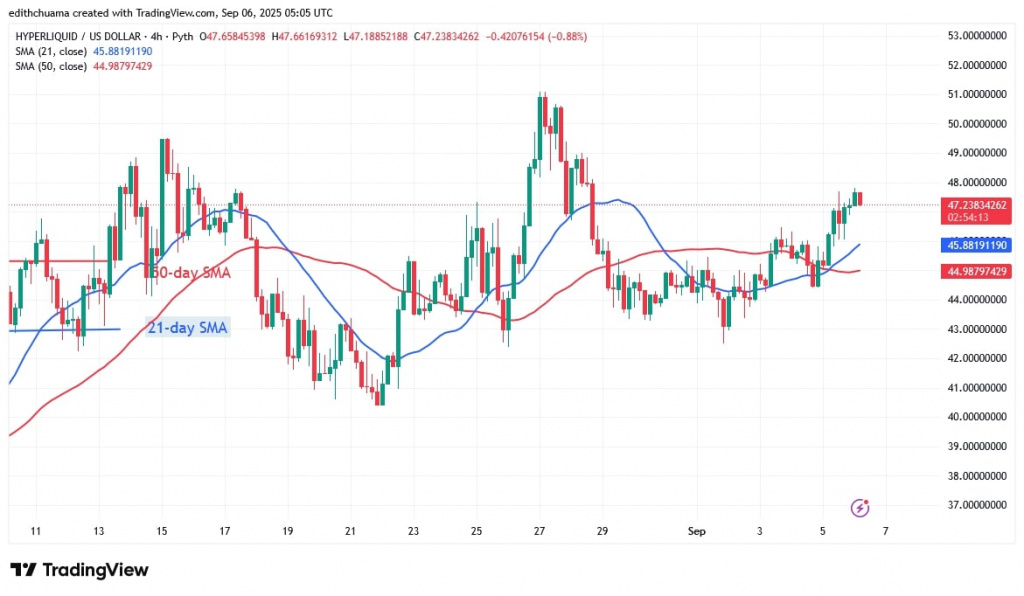
The upward sloping moving average lines are now sloping horizontally and point to a sideways move below $50. The 21-day SMA is above the 50-day SMA, indicating an upward movement. The price bars on the 4-hour chart are alternating above and below the horizontal moving average lines.
Technical Indicators:

HYPE/USD price chart – September 06, 2025
What is the next move for HYPE?
The HYPE price continues to move within a trading range, with the uptrend being held back by the $48 level. On the 4-hour chart,the altcoin is trading above the $43 support but below the resistance of $48. Doji candlesticks are formed as the altcoin continues to fluctuate inside a limited range.

HYPE/USD price 4-hour chart – September 06, 2025
Disclaimer. This analysis and forecast are the personal opinions of the author. The data provided is collected by the author and is not sponsored by any company or token developer. This is not a recommendation to buy or sell cryptocurrency and should not be viewed as an endorsement by CoinIdol.com. Readers should do their research before investing in funds.


