
Bitcoin is entering a new phase after months of dominance and sustained gains. For the first time since late 2022, BTC is lagging behind while Ethereum and several altcoins begin to show strength. This shift has caught the attention of investors, as Bitcoin has long been the main force driving the broader market’s momentum. Now, with Ethereum taking the crown, the spotlight has temporarily shifted away from BTC.
Top analyst Darkfost points out that old Bitcoin whales are becoming active again, adding to the uncertainty. Among them is one whale who continues to swap BTC for ETH on Hyperliquid. According to Darkfost, this whale is most likely a miner, as evidence links their activity to the Bixin platform, which mined its last block back in 2019. Such movements suggest that early holders and miners may be diversifying their portfolios, contributing to the growing capital rotation trend.
This dynamic reflects a key moment in the cycle, where Bitcoin’s leadership is challenged while Ethereum builds momentum through both institutional demand and whale accumulation. The coming weeks will determine whether BTC can reclaim its dominance or if ETH continues to drive the next stage of the market.
Old Bitcoin Whales Drive Market Uncertainty
According to Darkfost, old Bitcoin whales have played a major role in the recent increase of dormant BTC being moved and sold, raising red flags across the market. These wallets, often tied to early miners and long-term holders, are becoming active once again, fueling speculation about their motives. Historical trends suggest that whenever such activity picks up, it tends to coincide with overheated markets and often marks the beginning of corrective phases.
Darkfost highlights the Spending Binary CDD (Coin Days Destroyed) as a crucial indicator in the current cycle. This metric, which tracks the movement of older coins, has reached critical levels once again—levels that in past cycles consistently preceded market corrections. The reasoning is simple: when coins that have remained untouched for years are suddenly sold, it signals distribution by early investors and introduces additional supply into the market at sensitive points.
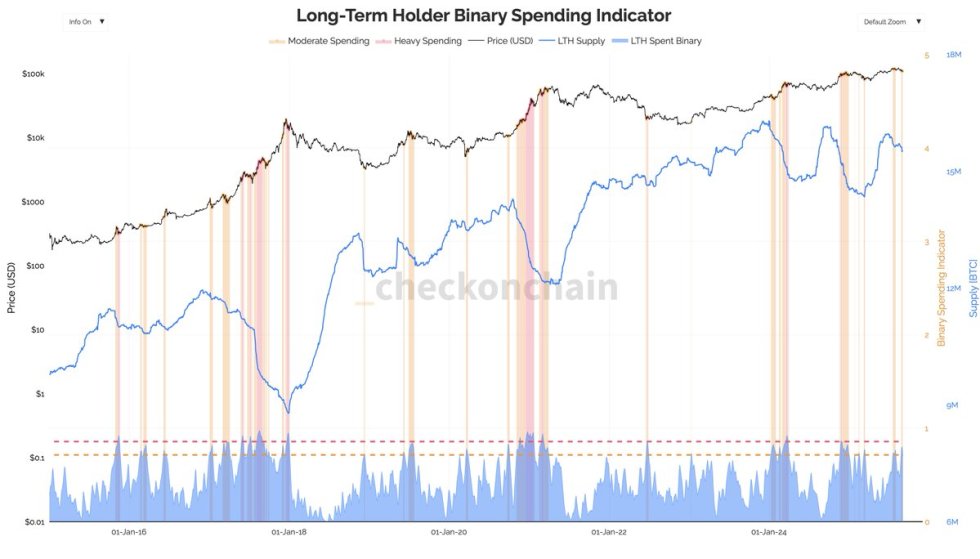
The current environment mirrors this exact setup. Bitcoin’s price action shows consolidation and fading bullish momentum, while Spending Binary CDD reinforces the likelihood of continued downside pressure. Darkfost warns that unless demand rises significantly—or these old BTC stop being moved—it will remain extremely difficult for Bitcoin to break out of its current consolidation phase.
If demand does not offset this increase in selling pressure from old wallets, Bitcoin may face deeper corrections before finding stability. On the other hand, a pause in whale distribution could open the door for BTC to regain strength. Either way, the behavior of these old holders will heavily influence Bitcoin’s short-term trajectory.
Price Action Details
Bitcoin (BTC) is currently trading around $111,255, showing signs of recovery after a sharp decline that pushed it near the $108K region. The chart highlights how BTC recently bounced off the 200-day moving average (red line), a key long-term support level that has historically provided stability during corrections. Holding above this line is crucial for maintaining the broader bullish structure.
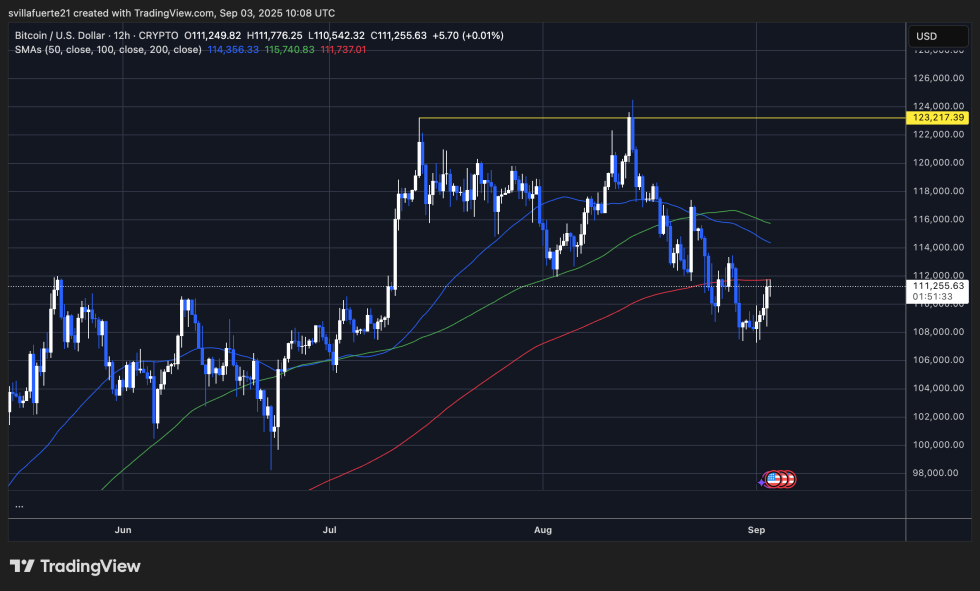
On the upside, BTC faces immediate resistance at the 100-day SMA (~$115,740) and the 50-day SMA (~$114,356). Both moving averages are trending above current price levels, creating a potential confluence of resistance that could limit short-term upside momentum. Unless BTC can break and sustain above these averages, the market may see continued consolidation between $108K and $115K.
The yellow line at $123,217 remains the critical resistance point to watch, representing the last major high before the recent correction. A successful reclaim of this level would signal renewed bullish momentum and could reset the trajectory toward new highs.
Featured image from Dall-E, chart from TradingView

Editorial Process for bitcoinist is centered on delivering thoroughly researched, accurate, and unbiased content. We uphold strict sourcing standards, and each page undergoes diligent review by our team of top technology experts and seasoned editors. This process ensures the integrity, relevance, and value of our content for our readers.
 Pullback Looms, But Analyst Sticks to $10K Target")


